25 Apr 2024 |
Active Lives Adults Release 22-23 unpacked
Covering the period from mid-November 22 to mid-November 23 this report provides an update on the sport and physical activity behaviours of adults (aged 16+ in England).
To look more at the data, go to our Data Hub
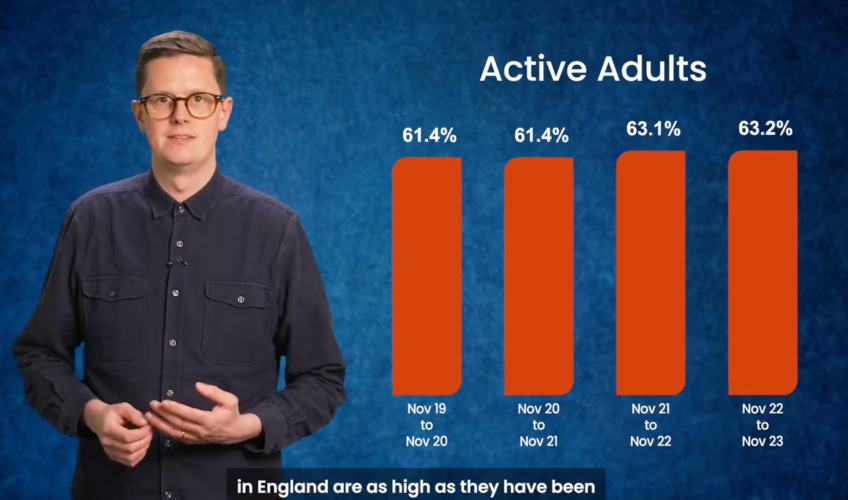
When we look at the population as a whole, the picture is positive. Activity levels for adults in England are as high as they have been since the survey started nearly 10 years ago. Despite a global pandemic and cost-of-living increase the nation as a whole is an active one with nearly two-thirds of adults achieving the recommended levels of activity. Since the survey started in 2015-16 the number of active adults has increased by two million.
A quarter of the population remain inactive and activity levels are significantly lower if you are less affluent, if you live in a more deprived place or come from certain demographic groups. Interestingly the survey also shows ongoing shifts in the types of activity people are doing with increases in active travel and fitness and the continued recovery of swimming and team sports.
Overall national activity levels can be seen below. 63.4% of the population are active.

Overall activity levels have remained stable over the last 12 months. There is no reportable change in the number who are inactive over teh same period but there has been a decrease of 404,000 in the number who are fairly active. When we look at demographics we see the following:
Gender
Men are still more likely to be active than women and those who describe themselves in another way. Both men and women have seen activity levels increase over the last seven years, where growth has been similar. There has been no change in the last 12 months.
Socio-economic Groups
People in lower social groups are less likely to be active. There have been no reportable changes over the last 12 months. The most affluent have seen long-term growth, with those who are active increasing by 1.6% compared to seven years ago. In contrast the least affluent (NS SEC 6-8) have seen the proportion of active people drop by 2.2% over the same period.
Deprivation of Place
Activity levels remain unchanged over the l;ast 12 months for those living in the most deprived places. Over the longer term we are seeing increased inequalities based on where someone lives. The least (IMD 8-10 +2.5%) and mid (IMD 4-7, +1.3%) deprived places are seeing more active adults compared to seven years ago, whereas the most deprived places (IMD 1-3) have seen this proportion fall by 2.5% over the same period.
Age
Activity levels generally decrease with age, with the sharpest decrease coming at age 75+. The proportion of 16-54 year olds who are active remains 2.2% down compared to seven years ago. Adults 75+ continue to drive the growth in activity levels. The increase of just over 100,00 (1.6%) adults aged 7+ are active compared to 12 months ago is part of a long-term increase of just under 700,000 (9.4%) compared to seven years ago (Nov 15-16). Those aged 55-74 also have a long-term upward trend in the proportion of active people. For both age groups the latest result represents the highest result orecorded over the last seven years.
Sexual Orientation
Gay men, lesbian women and bisexual people are alkl more likely to be active than heterosexual adults.
Ethnicity
Significant inequalities continue to exist. There has been no change in activity levels for Black, Asian or minority ethnic groups compared to 2015-16 . This means inequalities continue to widen as White British adults have seen an increase of 2.1% over the same period.
Disability and Long-Term health conditions
Activity is less common for adults with a disability or long term health condition than those without.
Type of Activity
Both active travel and fitness numbers continue to reover. Over a million more active adults (+2.1%) have walked or cycled for travel and 802,000 (+1.5%) more have taken part in fitness activites compared to 12 months ago.
Cycling and running remain down over the longer term. They continue to fall, with all the gains during the pandemic now lost.
Swimming and team sports continue to recover. Swimming numbers are back in line with pre-pandemic and team sports numbers continue to increase and are now at the highest level seen for six years.
Volunteering
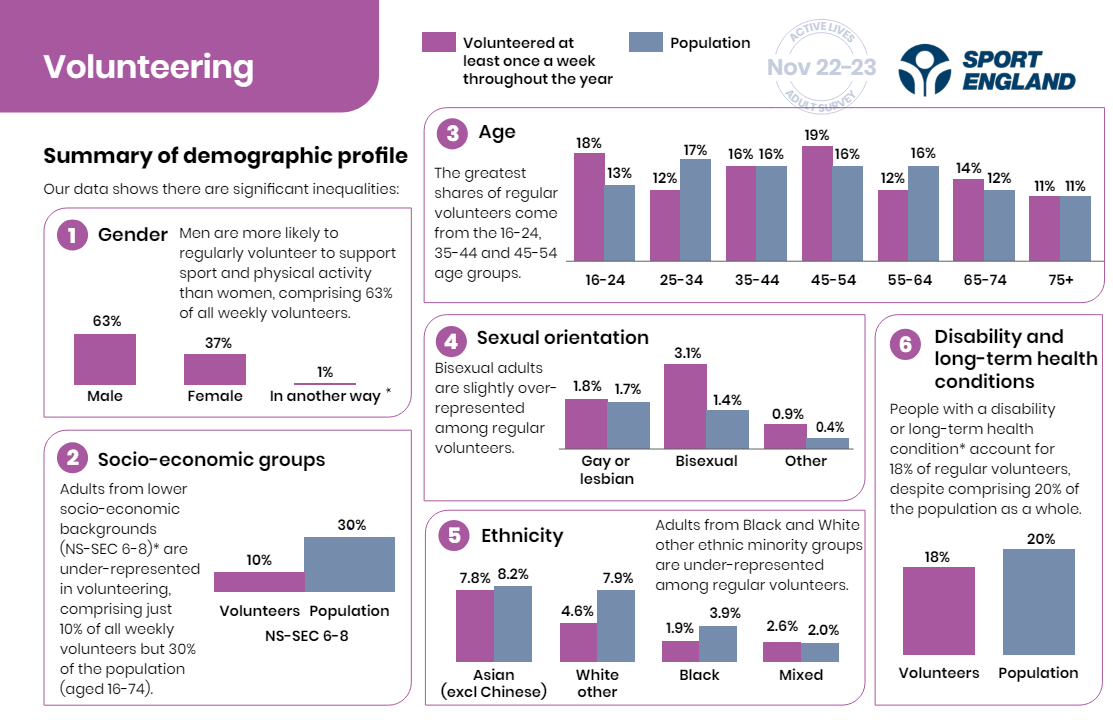
Volunteer levels continue to recover but an underlying long-term downward trend continues. 10m adults volunteered to support sport and physical activity. This is 1.2m more compared to the previous 12 months. This is still lower than it was seven years ago.
Local Data
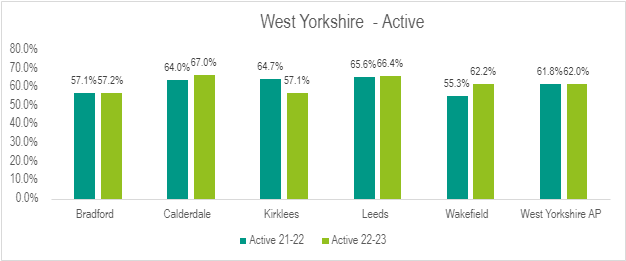
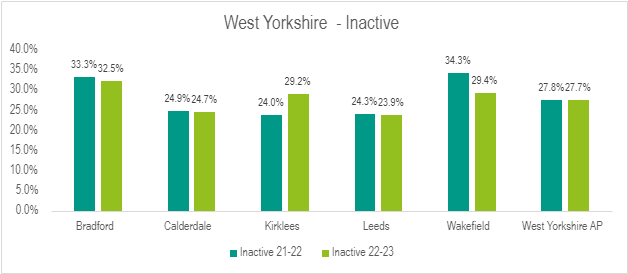
What's new
Funding
£1 million competition to take active travel innovation to…
Department for Transport and Active Travel England launch a £1 million competition where…
13 Oct 2025
Report reveals impact of inequality on girls’ sport
Youth Sport Trust Girls Active 2025 Research find girls faced with multiple characteristics of…
10 Oct 2025
Funding
Grow Your Club grants in Wakefield
Applications are now open for the 2025 Grow Your Club grant programme designed to help grassroots…
9 Oct 2025
Read more news, funding, jobs, courses and events


